In a previous post, we explored and visualized population-adjusted gun sales, looking at many dimensions of time series data. We also fit a prediction and forecast applying the Box-Jenkins framework of identification (including stationarizing), estimation (SARIMAX), and model diagnostics.
Today, we’ll focus specifically on the structural break in the gun sales time series data. The purpose is to:
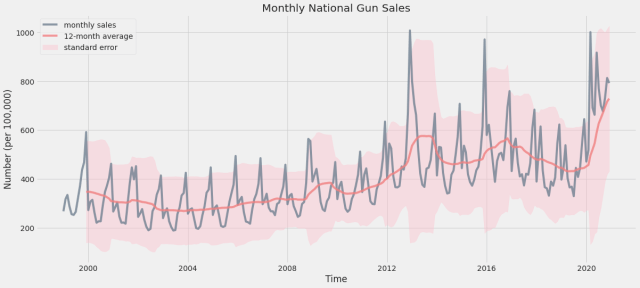
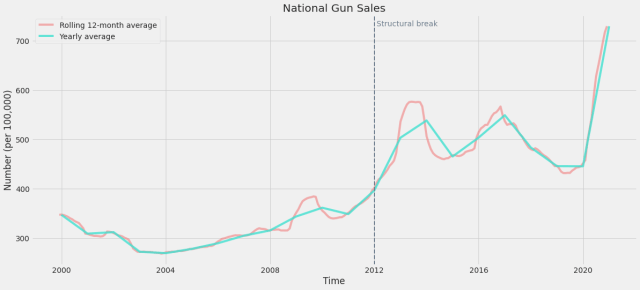
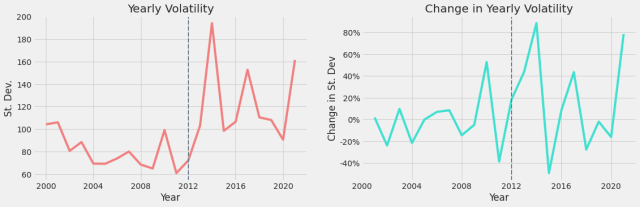
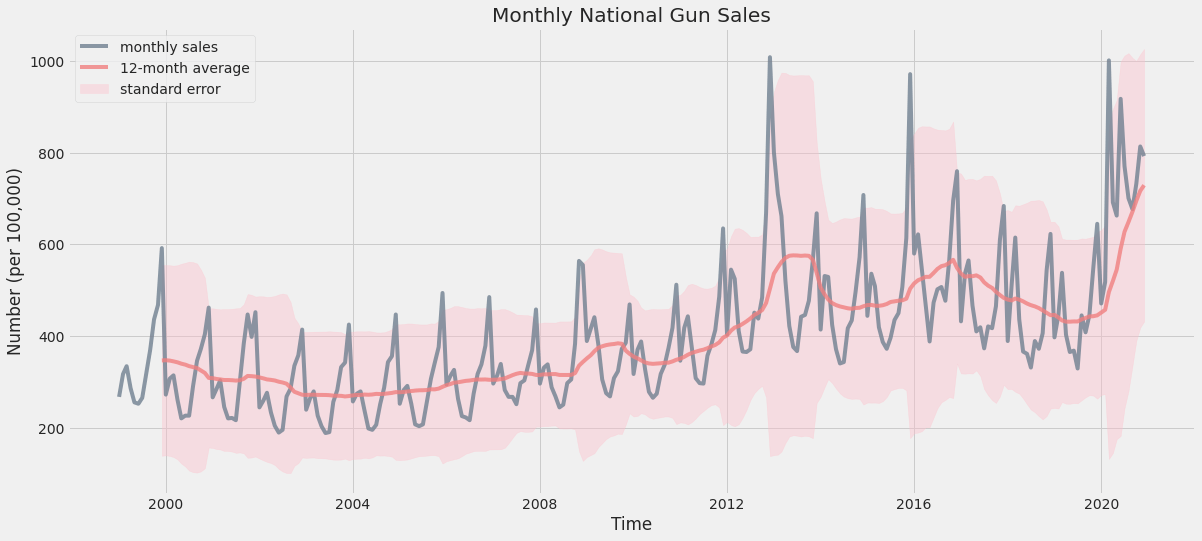
- Visualize time series dimensions (rolling, yearly average, volatility),including a structural uptick in gun sales beginning 2012
- Quantify this structural break using chow test and looking at volatility.
For the chow test, our null hypothesis is that there’s difference between two sub-periods. We’ll run three regressions of sales with year, one over the whole time period (pooled), one before the breakpoint, and one after the breakpoint and take the sum of squared residuals for each. The chow test follows an f distribution with k degrees of freedom in the numerator and N1+N2-2k degrees of freedom in the denominator.
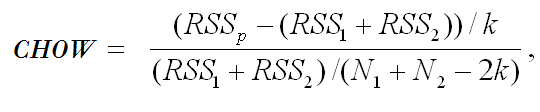
Our calculated chow test statistic is above the critical value, meaning we can reject our null hypothesis and accept our alternative hypothesis of a structural break. Structural changes are often also accompanies by changes in volatility – we’ll visualize volatility and % change in volatility to further illustrate the structural break.
Background check data originates from the FBI’s National Instant Criminal Background Check System (NICS). Original data is available as a pdf. If you’d like to extract the csv from the pdf directly, you can do so using BuzzFeed’s parsing scripts or Tabula. According to the data pdf, “These statistics represent the number of firearm background checks initiated through the NICS. They do not represent the number of firearms sold. Based on varying state laws and purchase scenarios, a one-to-one correlation cannot be made between a firearm background check and a firearm sale.” Important things to keep in mind for our analysis:
- We focus on background checks by month, state, and gun type, namely long guns, which include rifles and shot guns, and handguns.
- We exclude permit check/recheck as regulations vary widely by state- Also excluded are ‘other’ gun background checks.
- FBI’s NICS data only include licensed commercial gun sales and exclude private gun sale, which often don’t undergo a background check and represent a sizeable portion of total gun sales. Additionally, many background checks are carried out for concealed carry permits, not gun sales (e.g., Kentucky runs a new check on each concealed carry license holder each month).
To convert background checks to sales (number of units), we apply the multiple gun sales factor (MGSF) multiplier found in Jurgen Brauer’s Small Arms Survey, which is based on interviews with gun shop owners: multiply background checks for handguns by 1.1, long guns by 1.1, and multiple guns by 2 (page 44). Because state laws and individual transactions differ, sales between states cannot be directly compared. Despite those caveats, the FBI’s NICS numbers are widely accepted as the best proxy for total gun sales in a given time period. Additionally, to adjust sales for population growth, we’ll pull monthly U.S. population data from Federal Reserve Economic Data (FRED).
Future areas to explore include factors behind the structural change, including shifts in background check reporting and policies among states, economic shocks, legislation, and political change and uncertainty.
Code below and on Google Colab and Git. Lets’ dig in!