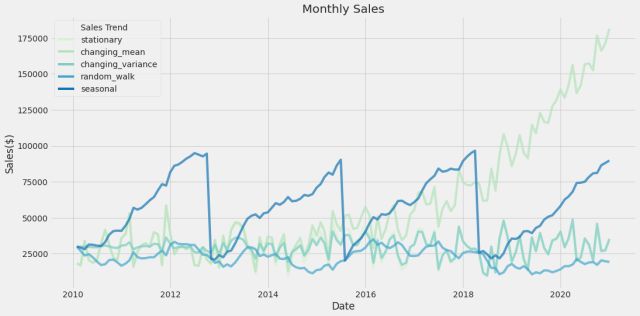
Today, let’s see how different missing value impute methods stack up for various types of time series. It was inspired by a recent Berlin Time Series Analysis meetup, you can check out the original code here. First, we’ll generate imaginary monthly sales data (from a normal distribution) from January 2010 to November 2020 in 5 different types of series – stationary, changing mean, changing variance, random walk, and seasonal. Next, we’ll generate sales with randomly removed values and fill them. To do so we’ll create a mask to tag missing and filled values, generate random missing values (15%) using the boolean mask to replace those index values with null values, and fill the missing values using the following impute methods:
- Mean
- Median
- Most frequent (mode)
- Last (forward fill): first preceding non-null value
- Next (back fill): next non-null value
- Last Next: mean of forward and back fill
- KNN: mean of k nearest neighbors
- Iterative: predicts value using regression, done sequentially multiple times allowing prior imputed values as part of model
- Zeroes
Lastly, we’ll see how the impute methods performed for each series based on their mean absolute error (MAE). Key findings according to MAE:
- Mean of forward and back fill performs best for changing mean, random walk, and seasonal series
- Back fill performs best for a changing variance series
- KNN performs best for a stationary series
- Mean and median aren’t appropriate for changing mean and seasonal series, however they can be used for a stationary series
- Most frequent and zeroes performed poorly for all series
It’s important to note that here we generate random missing values to test out how different imputation methods perform in different time series trends. In reality, when data includes missing values, it’s important to understand the context and problem you’re trying to solve, how the data is collected and study design, where the missing data came from (e.g., random, business holidays, non-response, etc.), and how we could expect missing values in the future.
Code with explanatory notes are on our Git and below as a gist.